US Housing Market Trends: Price Growth Persists Amid Rising Inventory
The report, published by CoStar Group's (NASDAQ: CSGP) online residential marketplace, separated price performance by housing type.
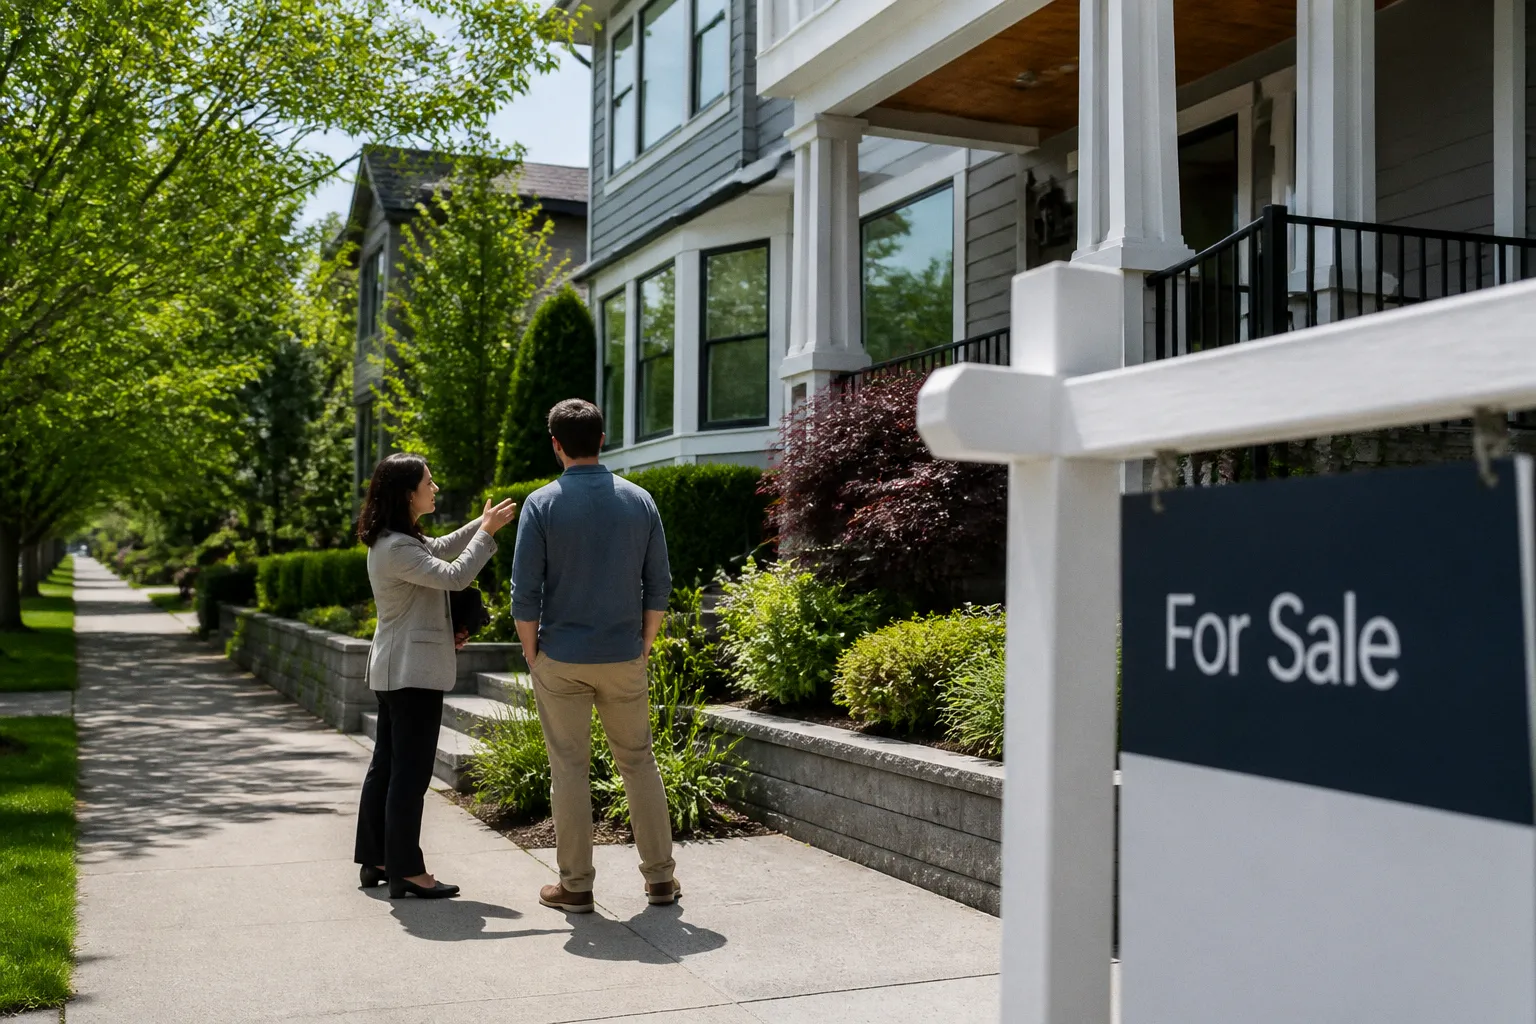
The national median sale price reached $400,000 in July, up 2.6% from a year earlier, according to Homes.com's July 2026 housing market report released this week. Closed sales climbed 2.9% year over year while active inventory expanded 4.4%—supply and demand rising in tandem without compressing the aggregate median. For Seattle, the national headline is secondary; the relevant data point is the metro's placement among softening markets alongside Raleigh, Dallas-Fort Worth, and San Jose.
National Numbers, Decomposed
Single-family homes gained 2.5%, condos rose 2.3%, and townhomes increased 0.8% annually. Inventory growth concentrated in the townhome segment, while single-family and condo supply expanded more moderately. Brad Case, Homes.com's Chief Residential Economist, attributed the aggregate resilience to a fading mortgage lock-in effect and greater seller participation despite rates climbing substantially between late February and late July.
Seattle's Place in the Divergence
Four metros posted stronger annual price growth than the national figure: Chicago, Baltimore, Pittsburgh, and New York. A second cohort—Seattle, Raleigh, Dallas-Fort Worth, and San Jose—registered softer prices. The split signals a market increasingly segmented by local supply-demand mechanics rather than uniform national trends. Puget Sound buyers and sellers should treat the 2.6% national benchmark as background context; the actionable signal sits in months-of-supply, absorption rates, and rate-driven lock-in behavior at the county level.
Indicators to Track Through Q4
1. Mortgage rate trajectory. The February-to-July rate climb set the Q3 baseline. Further basis-point movement in either direction resets buyer yield calculations and tests the durability Case referenced.
2. Local inventory absorption. A 4.4% national rise provides a reference point; King County months-of-supply data will determine whether Seattle tracks the softening cohort or decouples from it.
3. Lock-in erosion pace. Continued willingness among owners to list expands supply and caps upward pressure on prices. A stall reinforces existing floors.
4. Single-family versus condo spread. The 20-basis-point gap between the two categories nationally could compress or widen based on local new-construction delivery and HOA dynamics.
The binary read for the fall: Seattle either stabilizes as a softening market that has found its floor, or compresses further if rates push higher and local inventory continues to expand at the current trajectory.