Seattle light rail home search: a five-step transit plan
The Seattle light rail map changed the housing search. The 1 Line now extends north through Shoreline, Mountlake Terrace, and Lynnwood. The 2 Line has connected the Eastside across the I-90 corridor to Seattle since March 28, 2026.
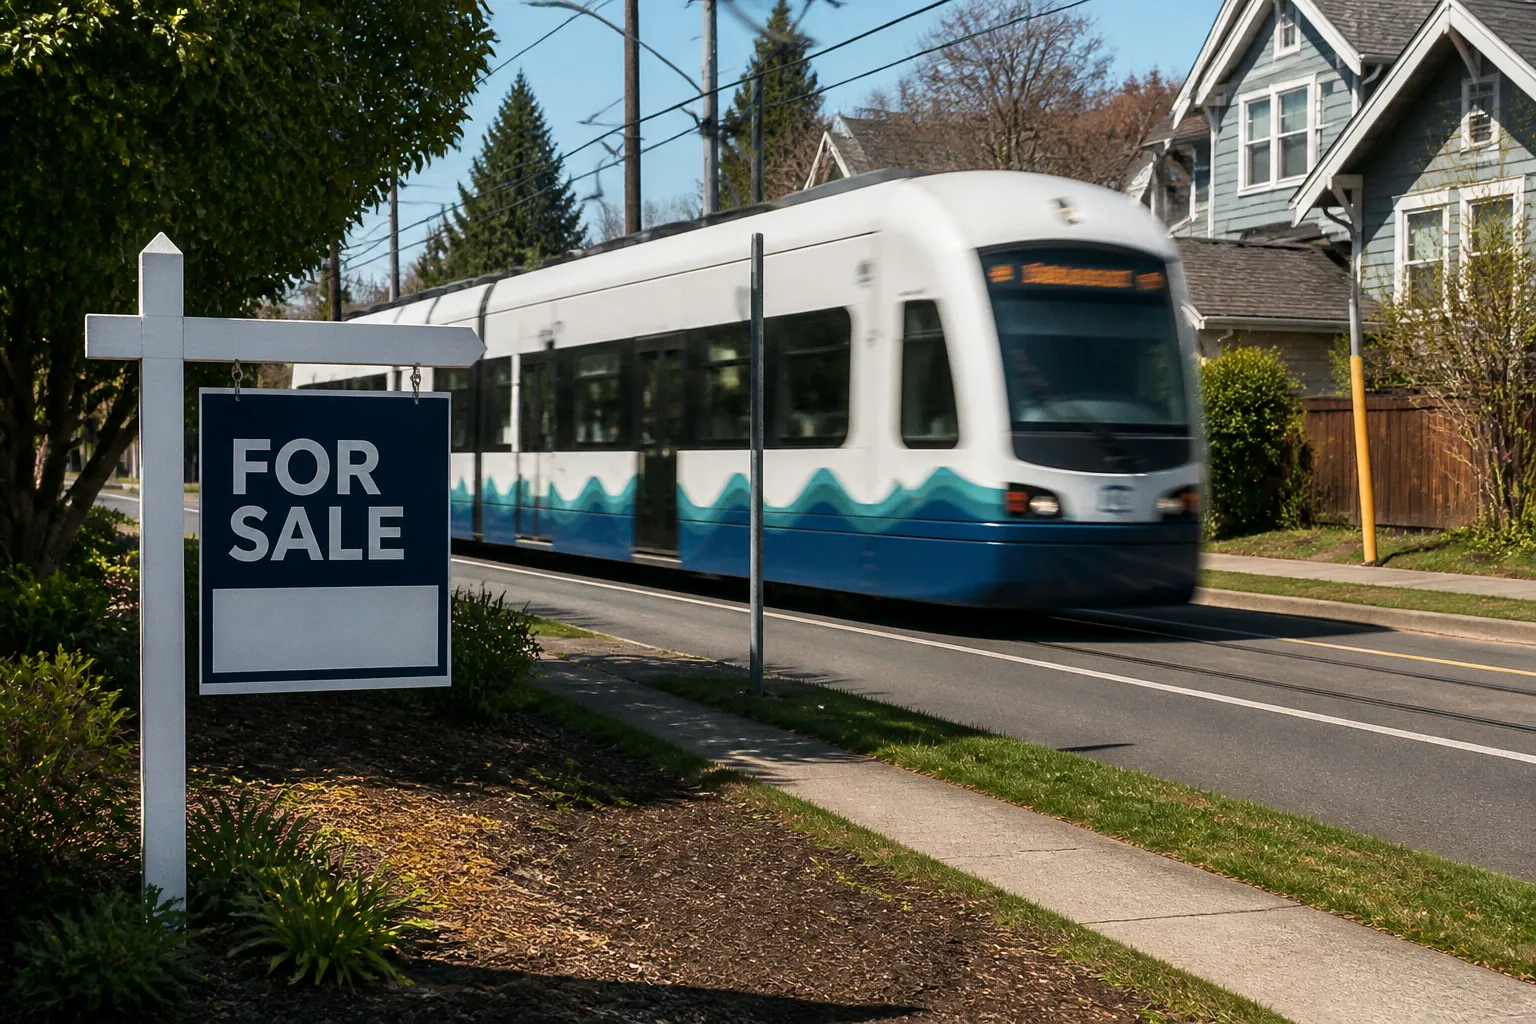
That creates a larger search area, but not a simpler one.
A home near a station is not automatically a superior asset. Transit access can support pricing, reduce car dependence, and improve rental liquidity. It can also introduce construction risk, noise, congestion, rezoning pressure, and a supply increase that limits short-term appreciation. The correct approach is to treat the station as one variable in a property model.
The following five-step plan is designed for a Seattle light rail home search across Seattle, Bellevue, Redmond, Shoreline, Mountlake Terrace, Lynnwood, and adjacent King County neighborhoods.
Step 1: Map the active Link Light Rail network before comparing homes
The first error in a transit-based home search is using the word “near” without defining the route, station, or service pattern. A property can be geographically close to rail and still perform poorly as a commute asset if the walk is indirect, the station entrance is poorly positioned, or the trip requires a transfer.
Sound Transit’s Link Light Rail system now operates through the 1 Line and 2 Line across King and Snohomish counties. The network serves major employment and education hubs, including Downtown Seattle, the University of Washington, Bellevue, Redmond, and Lynnwood.
The dates matter because the value proposition is not uniform across the map:
- The 2 Line starter segment opened on April 27, 2024, connecting South Bellevue with Redmond Technology.
- Downtown Redmond station opened on May 10, 2025.
- The Lynnwood Link Extension opened on August 30, 2024, adding four stations in Shoreline, Mountlake Terrace, and Lynnwood.
- The full 7.4-mile I-90 cross-lake connection began service on March 28, 2026, extending the 2 Line into Downtown Seattle.
- The West Seattle Link Extension has a projected opening date in 2032.
- The Ballard Link Extension has a projected opening timeline between 2037 and 2039.
That sequence divides the market into three distinct categories:
1. Established station markets. These have operating rail, known travel times, and observable buyer behavior.
2. Recently opened station markets. These have operating service but incomplete pricing history. The market is still calibrating.
3. Future station markets. These trade on expectations, planning documents, and development potential. They carry the highest execution risk.
For a buyer, the first category is easier to underwrite. The second requires more careful comparison. The third should not be priced as if the future station already exists.
Build the commute from the actual origin and destination
A rail map provides line geometry. It does not provide a commute.
For each candidate property, record:
- Walking time from the property entrance to the station entrance.
- The number of street crossings and the quality of the route.
- Train frequency during the actual commute window.
- Required transfers.
- Time from the destination station to the office, campus, or regular appointment.
- Parking or rideshare requirements at either end.
- The reliability of the alternative route when rail service is disrupted.
Core light rail segments can run at peak frequencies of approximately 4 to 8 minutes. That reduces scheduled waiting time, but total travel time still depends on access to the platform and the final connection. A 12-minute walk on one end and a 15-minute bus connection on the other is not equivalent to a home with a 5-minute station walk and a direct destination.
The 2 Line provides a useful example. The reported travel time between Downtown Bellevue and International District/Chinatown is approximately 20 minutes. That is a meaningful cross-lake connection. It does not mean every Bellevue or Seattle property has a 20-minute door-to-door commute.
Rail reduces the distance between employment centers. It does not eliminate the last mile.
Use station entrances, not station labels
Station boundaries are often broad. A listing may advertise a station as nearby because the property falls within a loose neighborhood radius. That is not enough.
Measure the route to the entrance that serves the relevant platform. In large developments, the difference between a building’s front door and its nearest station entrance can be several minutes. At a walking speed, those minutes compound over a working year.
A practical search map should use three rings:
- 0 to 0.25 miles: direct station access is plausible. Street conditions and entrance placement become decisive.
- 0.25 to 0.5 miles: the property is within the conventional transit-oriented development radius, but the route must be verified.
- Beyond 0.5 miles: rail may still be useful, but the property should not receive the same transit premium by default.
Step 2: Test the 0.5-mile radius against actual property pricing
The 0.5-mile radius is widely used in transit-oriented development analysis. It approximates a practical walking catchment area. It is also where many marketing claims become too broad.
A joint study by the American Public Transportation Association and the National Association of Realtors found that residential properties within 0.5 miles of public transit had median sale prices 4% to 24% higher than properties farther away. That range is broad. It should be read as evidence of a potential premium, not as a fixed Seattle adjustment.
The spread exists because transit is not a standalone asset. It interacts with:
- Employment concentration.
- Station design.
- Walkability.
- Local school assignments.
- Housing type and age.
- Traffic and parking conditions.
- Development capacity around the station.
- Perceived safety and street activity.
- The share of buyers who actually use transit.
A high-rise condominium near Downtown Bellevue is not priced by the same model as a detached house in Shoreline. A Lynnwood property near a large future development district has a different supply outlook from a mature Seattle station area. The station radius is the starting point, not the conclusion.
Separate the transit premium from the neighborhood premium
A station often arrives in a neighborhood that is already changing. New retail, rezoning, public investment, and employment growth may occur at the same time. If prices rise, the rail line may receive too much credit.
The analytical question is not whether homes near Seattle light rail stations cost more. They often do. The question is whether the rail connection adds value after controlling for the neighborhood’s existing characteristics.
For a buyer comparing two properties, use a compact matrix:
| Parameter | Property near operating station | Property farther from rail |
|---|---|---|
| Daily commute | Lower dependence on highway traffic and parking | More exposure to driving conditions |
| Purchase price | May include a transit and walkability premium | May offer a lower basis |
| Future supply | Often higher near station-area zoning | Usually less affected by station-led density |
| Resale audience | Transit users, car-light households, renters, investors | More dependent on parking and road access |
| Noise and activity | Potentially higher, especially near tracks and transfers | Usually lower rail-related exposure |
| Value driver | Access, frequency, employment connectivity | Lot size, school assignment, privacy, or parking |
| Main uncertainty | Whether the premium is already capitalized | Whether improved transit will matter to this location |
The table does not identify a universal winner. It identifies the variables that need a price.
Calculate the basis, not just the list price
For a transit-oriented purchase, the basis should include more than the contract price. Include parking, transit passes, expected vehicle costs, homeowners’ association dues, insurance, and any renovation required to compensate for a weaker location.
A higher purchase price can still be rational if it produces measurable savings or stronger liquidity. But the yield must be visible.
For an owner-occupant, the yield may appear as:
- Fewer vehicle miles.
- Lower parking expense.
- Lower time exposure to peak traffic.
- Greater flexibility for a two-worker household.
- Wider resale demand.
For an investor, the calculation is different. A transit premium can support rent and tenant demand, but the acquisition price may absorb most of the expected upside. A property with higher rent and a higher basis may produce a lower initial yield than a less expensive property farther from the station.
The correct comparison is not “near rail versus no rail.” It is net operating utility and resale probability per dollar of basis.
Step 3: Rank commute efficiency rather than distance
Distance to rail is an imperfect proxy. A five-minute walk to a station with a direct trip can outperform a property that is physically closer but requires a transfer, a shuttle, or a long walk through a fragmented street network.
A useful ranking system assigns each home to one of four commute profiles:
1. Direct and walkable. The station is within approximately 0.5 miles, the route is practical, and the train runs directly to the employment center.
2. Walkable with transfer. The station is accessible, but the commute requires a line change or a secondary mode.
3. Feeder-dependent. The property relies on a bus, shuttle, or drive to reach rail.
4. Rail-adjacent but car-dependent. The station is nearby in map terms, but the daily trip still requires a vehicle because of parking, school, work, or final-destination constraints.
The first profile deserves the strongest transit consideration. The fourth should not be priced as a true rail-oriented home.
Compare the 1 Line and 2 Line as different housing systems
The 1 Line and 2 Line do not serve identical market functions.
The 1 Line links Seattle with the University of Washington, north Seattle, Shoreline, Mountlake Terrace, and Lynnwood. Its extension creates a continuous north-south corridor with different housing forms and price structures. Station-area planning around Lynnwood City Center permits up to 6,000 new housing units within walking distance of the station. That is a substantial supply variable.
The 2 Line connects the Eastside and Seattle through the I-90 corridor. Its service changes the commute relationship between Bellevue, Redmond, and central Seattle. It also changes how buyers evaluate Eastside locations that were previously dependent on buses, highways, or transfers.
For the buyer, the distinction is operational:
- A 1 Line search may prioritize Seattle-to-north-corridor access, university proximity, and station-area redevelopment.
- A 2 Line search may prioritize cross-lake access, Bellevue employment centers, Redmond technology employment, and Eastside development patterns.
- A future-extension search requires a discount for timing and construction uncertainty.
Do not combine these corridors into one generic “light rail premium.” Their demand pools differ.
Score the commute at three time horizons
The commute should be tested at:
- Current peak: the trip as it operates today.
- Near-term stabilized service: the route after recently opened stations have settled into regular use.
- Long-term network condition: the effect of planned extensions, new housing, and changing employment geography.
The third horizon is useful for a long hold. It is not a substitute for current utility. A buyer who needs reliable access to Downtown Seattle now should not pay a full premium for a West Seattle or Ballard extension that remains years from operation.
Step 4: Read zoning and development plans as supply data
Transit-oriented development housing is often described as a demand story. The more consequential variable for some submarkets is supply.
A station can increase demand while also unlocking new density. Those effects do not arrive at the same speed. Existing owners may benefit from improved access before new units are delivered. Later, additional inventory can limit rent growth, slow resale appreciation, or create direct competition for older buildings.
Lynnwood City Center illustrates the mechanism. Planning around the station permits up to 6,000 new housing units within walking distance. That supports a larger pedestrian environment and may improve retail and services over time. It also creates a measurable inventory pipeline.
The buyer needs to distinguish between:
- Completed inventory: units already competing for buyers or tenants.
- Permitted inventory: projects that have zoning or approval support.
- Proposed inventory: concepts with no firm delivery schedule.
- Infrastructure-dependent inventory: projects relying on funding, environmental review, or future transportation work.
Only the first category is fully visible in current comparable sales. The others should affect the forecast, not be treated as completed facts.
Development can improve the block and dilute the scarcity premium
This is the central tradeoff in station-area housing.
New development may deliver:
- Better sidewalks.
- More retail frontage.
- Additional public space.
- More frequent bus connections.
- A larger tenant and buyer pool.
- Improved commercial viability.
It may also deliver:
- More competing units.
- Construction noise and access disruption.
- Higher traffic at constrained intersections.
- Changes in views and light.
- Greater pressure on parking.
- A smaller scarcity premium for older properties.
For a condominium buyer, the supply risk is direct. New buildings may offer elevators, amenity packages, efficient floor plans, and warranties. Older buildings need a compensating advantage, such as lower basis, larger units, stronger reserves, superior parking, or a better station route.
For a detached-home buyer, the impact may be indirect. Zoning changes can alter adjacent housing form, traffic, and neighborhood density. The station may improve access while reducing the assumption that the surrounding area will remain low-density.
Use a five-line development review
Before making an offer, reduce the station-area pipeline to five variables:
- Units approved or planned within walking distance.
- Expected delivery window.
- Housing type: rental, condominium, townhome, or detached.
- Direct competition with the target property.
- Infrastructure required to support the new density.
This review is more useful than a general statement that an area is “up-and-coming.” The phrase contains no inventory count, no timeline, and no pricing implication.
Transit creates access. Zoning determines how scarce that access remains.
Step 5: Price localized volatility instead of assuming automatic appreciation
Transit proximity can support a property’s marketability. It does not guarantee appreciation at every station.
An academic study of seven light rail stations in Seattle’s Rainier Valley found varied outcomes. Only one station showed a positive price effect, while two showed negative effects. The result is a direct warning against applying a single network-wide premium to every property near rail.
Localized performance can diverge because of:
- Station placement relative to existing commercial districts.
- Changes in crime perception or street conditions.
- Noise and vibration.
- New development that overwhelms existing infrastructure.
- Weak pedestrian connections.
- Different school and housing profiles.
- A mismatch between transit supply and local employment demand.
- The timing of buyer expectations relative to actual service.
The same distance to rail can therefore produce different yields in different neighborhoods.
Test the property against five market risks
A disciplined Seattle light rail home search should examine the following risks independently:
1. Operational risk. Service exists, but frequency, reliability, and transfers may not match the advertised commute.
2. Construction risk. Future extensions and station-area projects can create years of disruption before delivering benefits.
3. Supply risk. New units may reduce rent growth or resale scarcity.
4. Pricing risk. The current seller may already be capturing the expected transit premium.
5. Use-case risk. The buyer may still need a vehicle for work, childcare, school, or regional travel.
The fifth risk is frequently ignored. A buyer can live beside rail and remain functionally car-dependent. In that case, the home has the costs of a transit premium without delivering the full utility.
Compare total housing cost with total mobility cost
The right decision is often visible only after combining housing and transportation.
For each property, estimate:
- Mortgage or rent.
- Property tax and insurance.
- Homeowners’ association dues.
- Parking cost.
- Vehicle ownership and fuel.
- Transit fares and passes.
- Occasional rideshare or rental costs.
- Time spent commuting.
- Expected maintenance and special assessments.
The figures do not need to be exact to be useful. The objective is to prevent a narrow purchase-price comparison from hiding a recurring mobility expense.
A more expensive home near a direct station can work if the household genuinely uses the network. A cheaper home with weak access can work if the household values space, parking, school assignment, or privacy more than commute efficiency. Neither conclusion is automatic.
Use comparable sales with a narrow radius and a matched housing type
Transit-adjacent properties should be compared with properties that share:
- Similar housing type.
- Similar construction age.
- Similar parking arrangement.
- Similar school assignment where relevant.
- Similar distance to the station.
- Similar exposure to traffic, tracks, and commercial activity.
- Similar development risk.
A detached home near a station should not be benchmarked against a new condominium simply because both are within 0.5 miles of rail. The housing product is different. The buyer pool is different. The operating costs are different.
Median compression can also obscure the result. If higher-priced homes move faster while entry-level units remain stagnant, a neighborhood median may look stable even as the distribution changes. Review the composition of sales, not only the headline median.
The five-step decision model
A practical search can be organized into one scorecard. The score should not replace judgment. It should expose weak assumptions.
| Factor | Question | Strong signal | Weak signal |
|---|---|---|---|
| Network access | Does the line reach the actual destination? | Direct ride to a major employment or education hub | Multiple transfers or indirect route |
| Walkability | Is the route from the property to the station practical? | Continuous, safe-feeling, active street network within 0.5 miles | Barriers, steep route, large crossings, or feeder dependence |
| Current service | Is the benefit operating now? | Established or recently opened service with known schedules | Future extension used as the main justification |
| Supply outlook | How many competing units may arrive? | Limited direct competition or differentiated housing stock | Large permitted pipeline with similar units |
| Pricing basis | Is the premium supported by utility? | Lower mobility costs and broad resale audience | Seller pricing in all projected future upside |
| Local volatility | Has the station area shown consistent performance? | Stable demand across several market cycles | Mixed historical effects or unresolved externalities |
The property with the highest score is not necessarily the correct purchase. The property with the fewest unpriced risks is usually easier to own.
How to search by neighborhood
Seattle
Seattle station-area searches should separate mature neighborhoods from areas undergoing major development. A station can provide access to Downtown Seattle, the University of Washington, and regional connections, but the value of that access depends on the property’s street network and housing form.
A buyer should focus on the walk from the building, not the neighborhood name. The difference between a direct route and a fragmented one can determine whether rail becomes a daily mode or an occasional backup.
Shoreline, Mountlake Terrace, and Lynnwood
The Lynnwood Link Extension opened on August 30, 2024, adding four stations. These markets now have operating rail rather than a purely speculative transit thesis.
The central issue is inventory absorption. Station-area development can expand the local buyer and renter pool while adding substantial competition. Lynnwood City Center’s allowance for up to 6,000 new housing units makes the supply pipeline a core underwriting variable.
A buyer seeking a home near these stations should compare newer construction with existing properties on a price-per-use basis. The older property needs a clear offset: more space, lower monthly cost, stronger parking, better construction, or a materially lower basis.
Bellevue
Bellevue benefits from the 2 Line’s Eastside service and the cross-lake connection to Seattle. The reported travel time between Downtown Bellevue and International District/Chinatown is approximately 20 minutes, creating a direct regional link.
The Bellevue search should distinguish downtown employment access from broader Eastside mobility. A property can be well positioned for one and mediocre for the other. Premium pricing is more defensible when the station provides direct utility to the household’s actual work pattern.
Redmond and Kirkland
Redmond is directly connected to the 2 Line, including service to Redmond Technology and Downtown Redmond. That supports a stronger transit case for properties with practical access to those stations.
Kirkland requires more careful route analysis because not every neighborhood has direct Link access. A Kirkland property may still benefit from regional transit connections, but it should not receive the same valuation treatment as a home within a direct, walkable station catchment. The distinction is between network proximity and station access.
What to do before making an offer
The final search process should be mechanical.
1. Draw the 0.5-mile station radius. Then replace the circle with the actual walking route.
2. Record the current commute. Include walking, train, transfers, and final access.
3. Classify the station market. Established, recently opened, or future.
4. Read the development pipeline. Count direct competing units and note delivery timelines.
5. Adjust the basis. Include parking, mobility costs, association dues, and likely capital expenses.
6. Review comparable properties. Match housing type, age, parking, and station exposure.
7. Apply a risk discount to future benefits. A 2030s extension is not current infrastructure.
8. Run a resale test. Identify the next buyer or tenant and the reason they would pay the premium.
9. Check the downside case. Assume slower appreciation, more competing inventory, and no immediate benefit from future extensions.
10. Make the decision binary. Either the rail access produces enough present utility to justify the basis, or it does not.
The purpose of this process is not to eliminate uncertainty. Real estate does not permit that. The purpose is to separate operating facts from promotional expectations.
The market projection
The Seattle light rail home search will continue to expand as the 1 Line and 2 Line connect more employment centers across the Puget Sound region. Properties with operating, walkable, direct transit access should retain a liquidity advantage where the commute is demonstrably shorter and the buyer pool values car-light living.
The binary projection is clear:
- If station access is operating, walkable, direct, and not fully priced into the property, the location should outperform comparable car-dependent housing on utility and resale depth.
- If the premium is based mainly on a future extension, a broad station radius, or a generic claim about transit-oriented development, the buyer is paying for a forecast rather than an asset.
In this market, the rail line is real. The premium is conditional.