Seattle Construction Pipeline Expands Amidst Luxury Market Cooling
According to Seattle Agent Magazine’s August housing scorecard, Seattle housing starts increased annually in a market update published August 31, 2026.
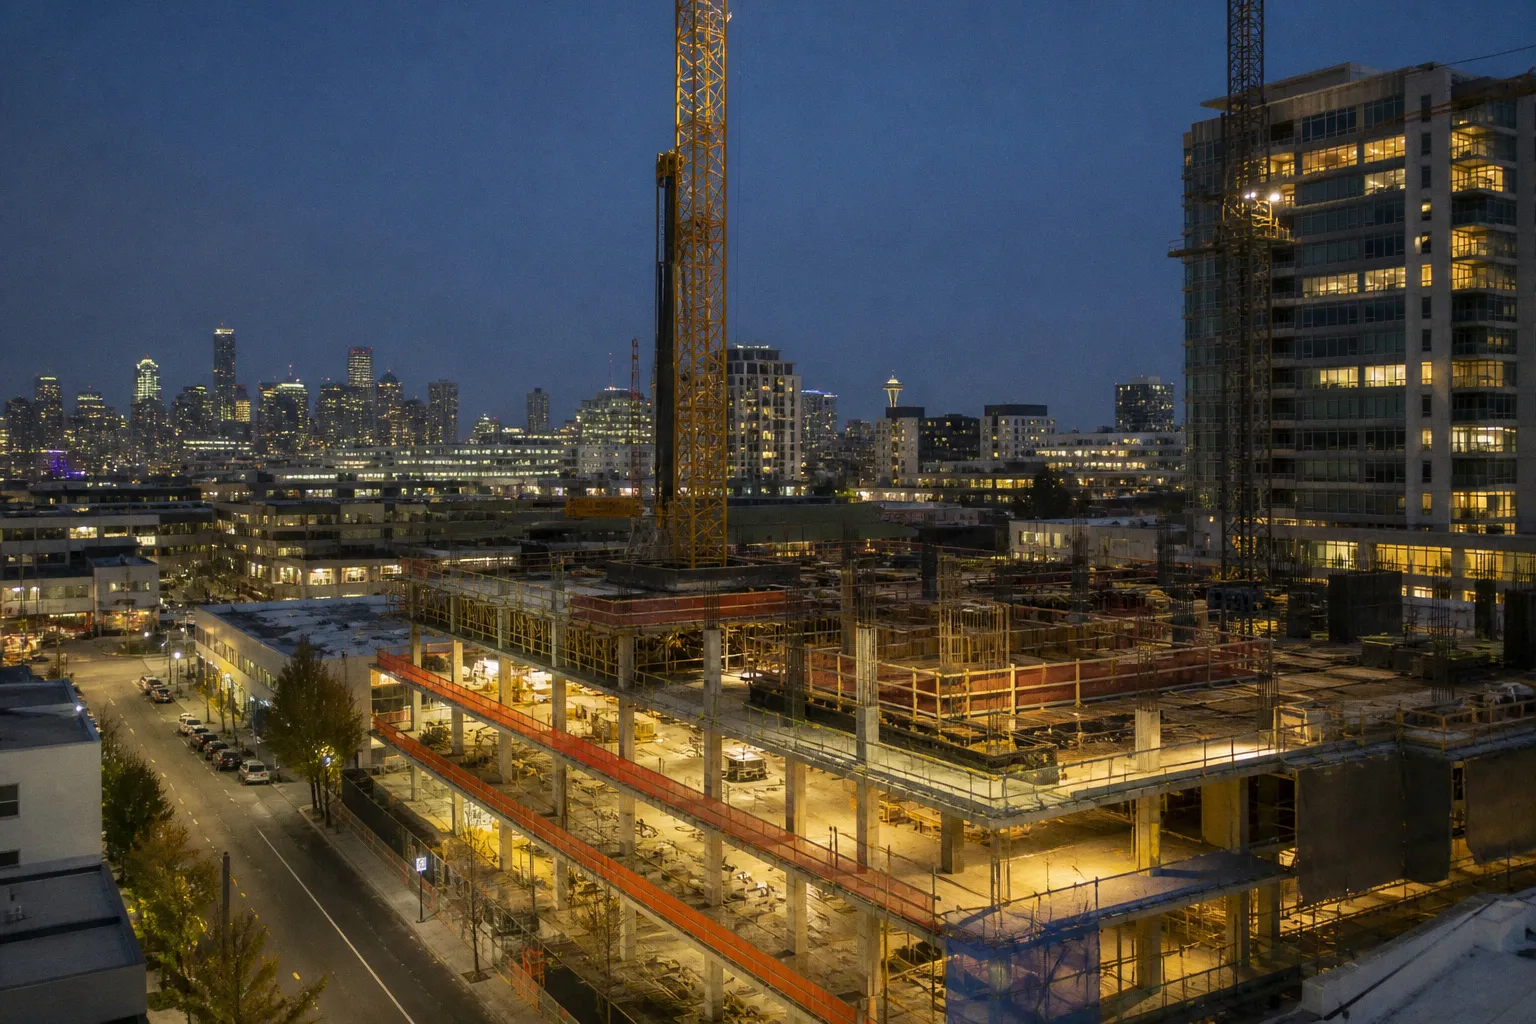
The entry provides no absolute project count, percentage change, or breakdown by property type. For buyers and sellers, the defensible conclusion is narrower: the construction pipeline gained ground, but the release does not establish when, where, or at what price the additional supply will be offered.
Starts rise while high-end absorption slows
More starts and slower transactions are not contradictory signals. Starts measure future construction activity; pending sales measure current contract activity. The gap is already visible in the luxury segment.
Briefs Finance reported that a Sammamish home listed at $2.9 million had remained on the market for more than 100 days, with the seller offering financing assistance. On the same street, a neighboring house launched in April at $2.2 million and later displayed a $2.09 million asking price. These are individual properties, not market indices, but they show the forms of adjustment occurring at the upper end.
The broader figures point in the same direction:
- Redfin reported that the Seattle area recorded the largest decline in pending home sales nationwide in July.
- Pending transactions for the priciest 5% of the market fell 15% over the three months through July compared with the prior year. Across the United States, luxury pending sales increased 2.6% over the same period.
- Windermere Real Estate found that listings above $2 million in six high-cost local MLS zones took about 44 days to find buyers in the first half of the year. That compared with 25 days in early 2025 and nine days in 2022.
- A rise in active listings has occurred alongside technology-sector job cuts, with sales lagging in Bellevue, Kirkland, Sammamish, and other upscale Eastside markets.
The distinction is material. Housing starts have increased, but inventory absorption has weakened where the available evidence is most detailed. The construction figure is not an immediate substitute for transaction data.
Employment contraction and investment are occurring together
The demand outlook is being shaped by two opposing technology trends. Microsoft, Amazon, and Meta Platforms have eliminated thousands of roles in the region as artificial intelligence changes staffing requirements. At the same time, Amazon and Microsoft continue to direct substantial capital toward expansion.
The two companies were responsible for about 20% of Washington’s economic expansion during the 10 years following 2014. This year, they are targeting approximately $395 billion in combined global capital spending to expand AI capacity. Anthropic is adding staff in Seattle, while OpenAI already employs hundreds of people in nearby Bellevue.
Venture investment shows a different scale of activity. Seattle recorded $1.5 billion in venture deals during the second quarter, compared with $98.6 billion in the Bay Area, according to National Venture Capital Association data citing PitchBook. The figures do not erase the effect of layoffs, but they show that the region is not operating under a single employment narrative.
Policy is another variable at the upper end. This year, Washington enacted a 9.9% income tax on households with annual income above $1 million. The measure applies to roughly the richest 10,000 households. It is directly relevant to a market segment already showing longer marketing times, but the available evidence does not quantify its effect on Seattle listings, negotiations, or pricing.
What to verify before making a decision
1. Obtain the underlying construction data. The published scorecard entry gives the direction of change but not the base, growth rate, or property mix. Those fields are necessary before converting starts into a supply forecast.
2. Track starts with active listings and pending transactions. A construction increase becomes meaningful supply only when projects progress toward saleable inventory. Pending sales provide the more immediate measure of demand.
3. Use segment-level evidence for luxury property. Listings above $2 million should be evaluated against the six-zone Windermere set and recent comparable properties. The 44-day figure is an aggregate, not an appraisal input for one address.
4. Record pricing and concession changes. Compare the original list price with the current price, note the number of days on market, and identify seller financing or other assistance. The Sammamish examples show why list price alone is insufficient.
5. Do not infer a citywide price reversal. More construction expands the forward pipeline. It does not demonstrate that current demand has stabilized or that additional supply is priced for entry-level buyers.
The market read is binary: the annual increase in starts becomes an effective supply signal only if subsequent data show those projects reaching the market while pending sales stabilize. Until that condition is met, treat housing starts as a forward construction indicator, not proof of an immediate market-wide recovery.