Seattle and Snohomish Housing Market Trends: Inventory and Pricing Shifts
According to Brenner | Hill Real Estate’s August 10 update, Northwest Seattle and Southwest Snohomish County are showing a modest shift: inventory declined, mortgage rates improved, and buyers gained…
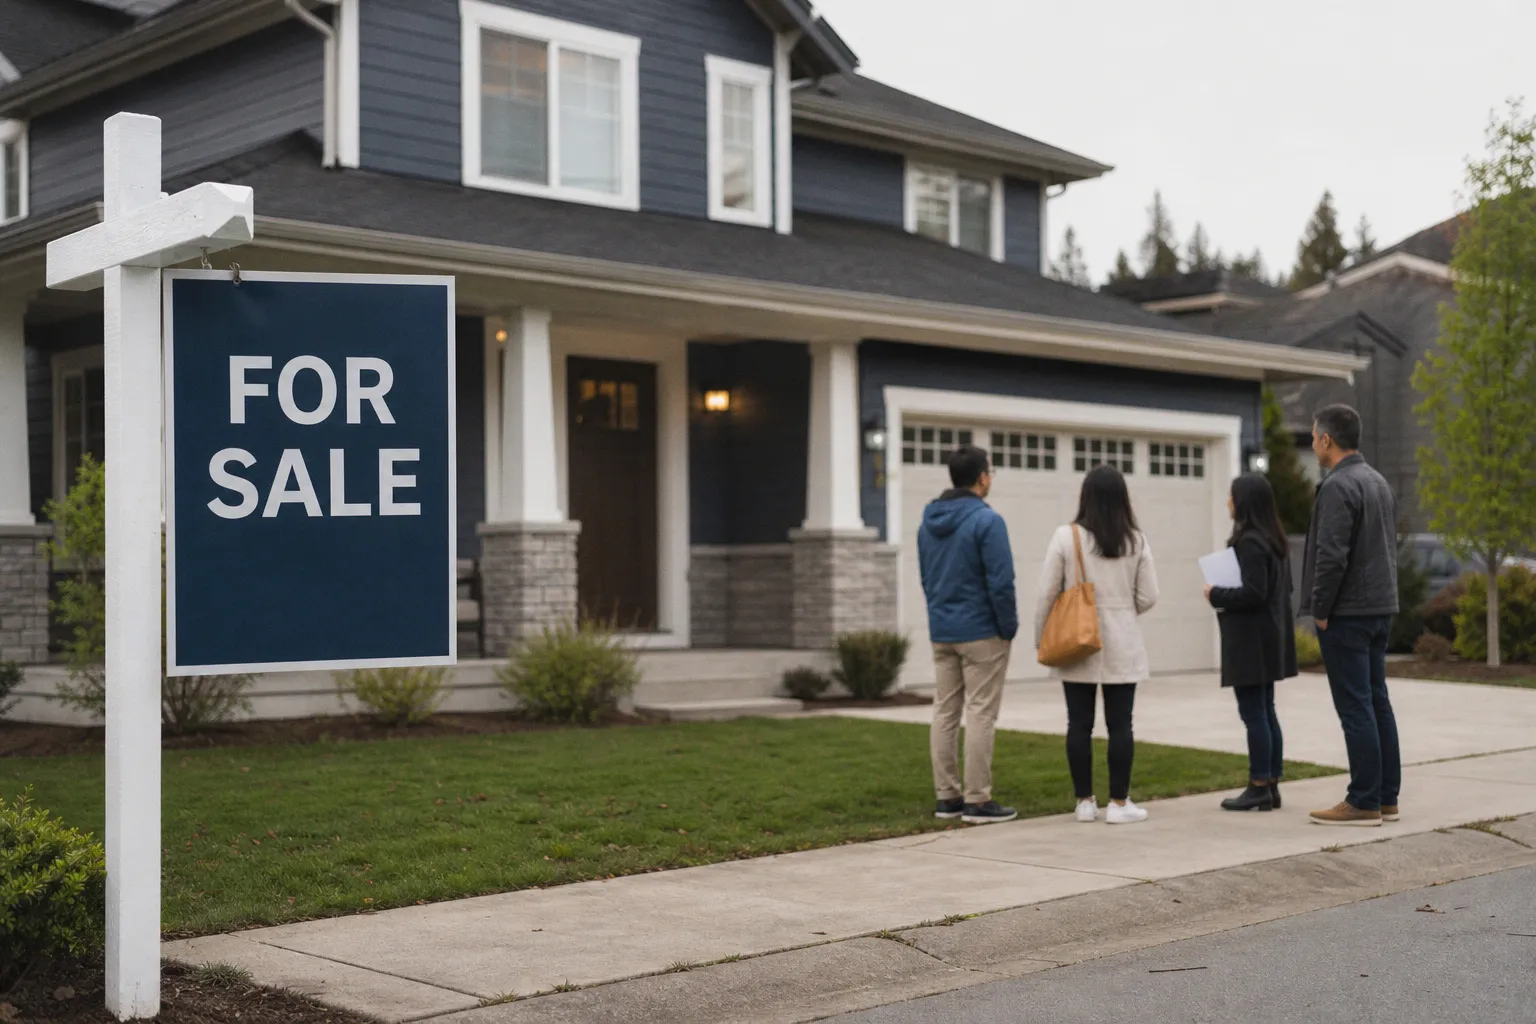
According to Brenner | Hill Real Estate’s August 10 update, Northwest Seattle and Southwest Snohomish County are showing a modest shift: inventory declined, mortgage rates improved, and buyers gained some purchasing power. The short-term signal is less decisive. Pending activity rose over the latest two-week period but dropped sharply in the most recent week, indicating a more selective buyer pool. For Seattle-area transactions, the data point to a market where pricing and presentation are becoming more important than broad demand.
Northwest Seattle: lower supply, weaker price-per-square-foot
The 30-year conventional mortgage rate declined from 6.625% to 6.375% during the period covered by the update. That is a 25-basis-point improvement. It did not produce a uniform acceleration in demand.
- Inventory fell 3.4% to 421 homes.
- New listings declined 19.2% from the prior two-week period.
- Homes going under contract increased 12.5%, from 64 to 72.
- Closed sales were essentially unchanged.
- Average price per square foot fell 4.5%, from $582 to $556.
The sequence matters. The increase in contracts appears constructive when measured across two weeks, but homes going under contract were down 15% in the latest week compared with the preceding week. That is a loss of momentum, not a confirmed reversal.
For sellers, lower inventory does not remove the need for market-specific pricing. The average price-per-square-foot decline shows that buyers are not simply absorbing available supply at prior benchmarks. A listing that misses its initial positioning may face a longer exposure period while competing homes remain available.
Southwest Snohomish: stronger closings, sharper weekly drop
Southwest Snohomish County produced stronger closed-sale results but the same underlying volatility.
- Inventory declined 1.6% to 377 homes.
- New listings fell 20.7%.
- Homes going under contract increased 8.6%, from 58 to 63.
- Closed sales rose 12.2%.
- Average price per square foot increased 11.1%, from $432 to $480.
The $432 starting point was identified by Brenner | Hill as an anomaly for the year, so the increase should not be treated as a clean measure of price appreciation. The more immediate indicator is pending activity: contracts fell 42% in the latest week from the prior week.
That combination creates a divided market signal. Closed sales reflect transactions already moving through the pipeline. Pending sales provide a more current view of buyer commitment. In both submarkets, the latest weekly data are weaker than the broader two-week comparison.
The regional benchmark is still buyer-oriented
Windermere principal economist Jeff Tucker reported that the broader Western Washington market remains soft. Across the Northwest MLS, July closed sales were down 2% year over year, while active listings were up 19%. The median sale price declined approximately 2% from the prior July to $660,000.
In the four-county greater Seattle area, closed sales declined 3% year over year. King County recorded a 10% drop, while Snohomish County rose 3%. The region ended July with 23% more active listings than a year earlier. Snohomish County’s median sale price fell 6% to $757,000, while King County’s median was down $5,000 from $1 million in each of the previous two Julys.
The practical conclusion is binary. If inventory growth continues and pending sales remain weak, buyers will retain leverage into the fall and sellers will need sharper pricing, stronger presentation, or both. If mortgage-rate improvement converts into sustained weekly contract growth, competition can stabilize selectively—but the current evidence does not yet establish that outcome.