Kirkland Real Estate Shifts Toward Neutral Territory as Inventory Climbs
4% year-over-year in July, pushing the Eastside submarket into neutral territory according to an August 2026 market update from George Moorhead, compiled from Northwest Multiple Listing Service data.
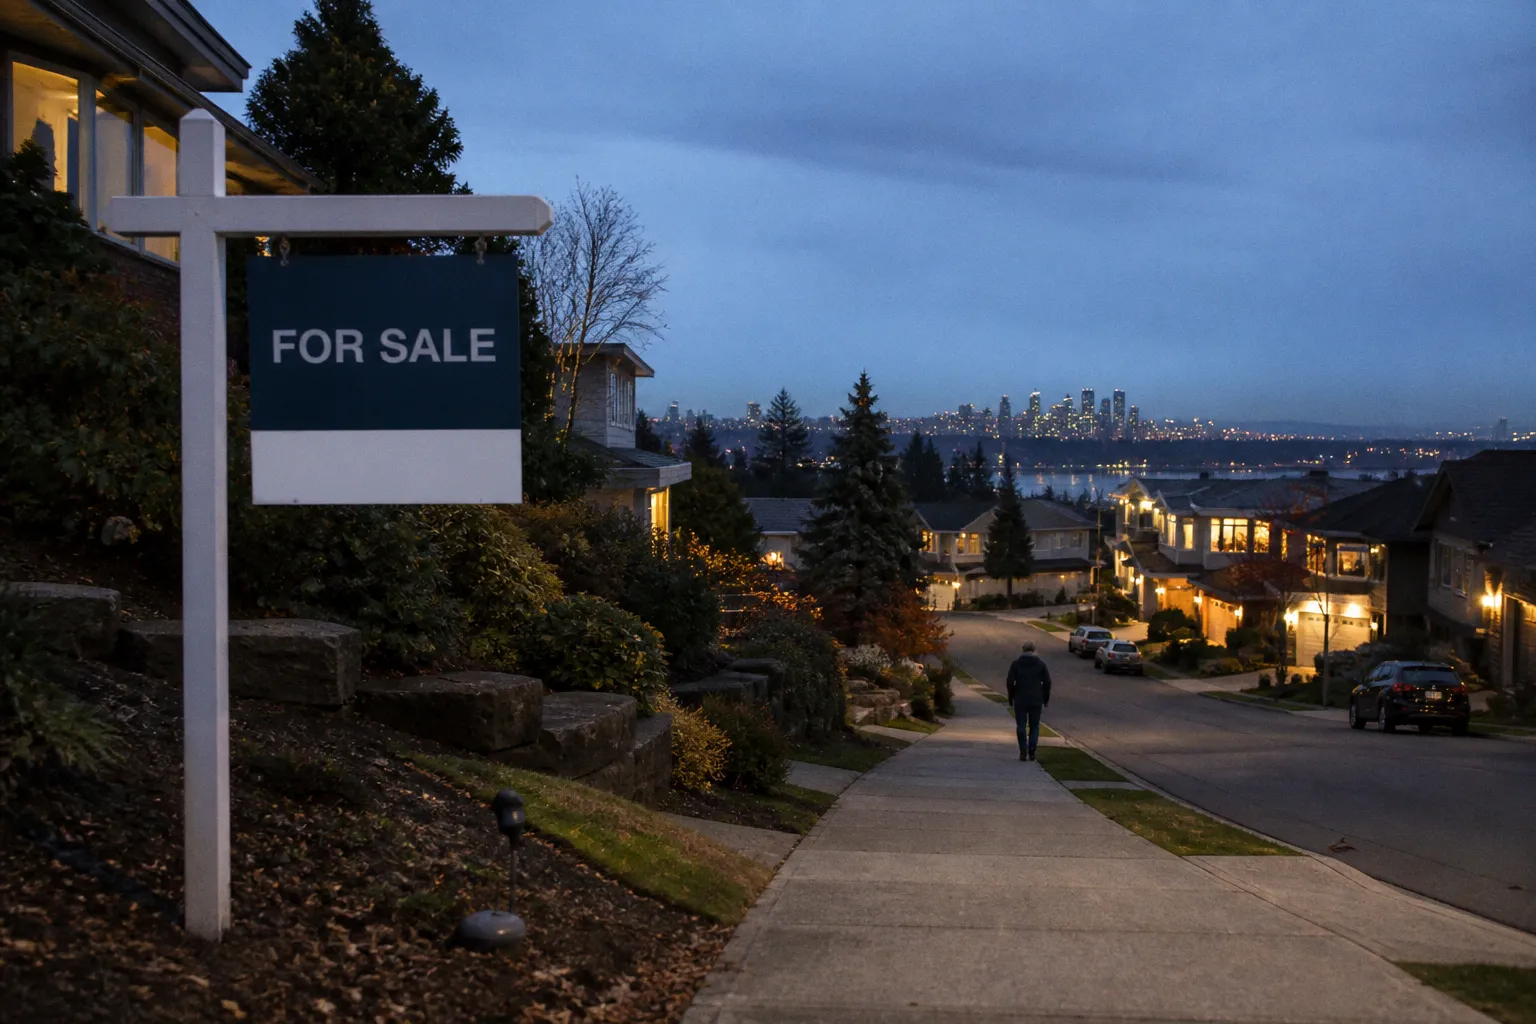
Kirkland's housing inventory expanded 39.4% year-over-year in July, pushing the Eastside submarket into neutral territory according to an August 2026 market update from George Moorhead, compiled from Northwest Multiple Listing Service data. Active listings climbed 5.1% month-over-month against a 10.1% year-over-year drop in closed sales, defining a market where supply expansion outpaced transaction velocity.
Supply and Velocity
Active listings in Kirkland reached 99 units above the prior July, with months of inventory based on closed sales climbing to 4.9, up 53.5% year-over-year. Closed transactions for July totaled 71 properties, down 10.1% from a year earlier and 24.5% from June. Pending volume offset the slowdown at the contract stage: 80 pendings, up 21.2% month-over-month and 3.9% year-over-year. Days on market averaged 26, up 36.8% from 19 days in July 2025 but down 10.3% from 29 in June.
Price Compression
The average sold price per square foot fell to $730, down 9.4% from $806 the prior month and 6.3% from $779 in July 2025. Median sold price dropped 6.1% month-over-month; average sold price fell 13.6% month-over-month. The sold-price-to-original-list-price ratio held at 96%, down 2 percentage points year-over-year, signaling sellers conceding more from initial ask. Six-month trend indicators on both median and average sold price registered neutral.
Regional Context
Kirkland's compression aligns with broader Eastside softness flagged in the JanusGroup's August 2026 Seattle market update. The Eastside median sale price landed at $1,378,000, down 1.57% year-over-year, while Seattle proper rose 0.57% to $884,500 and King County overall rose 0.51% to $879,500. Nationally, Redfin data cited through Morningstar showed new listings up 1.2% week-over-week for the four weeks ending August 16, with a U.S. median sale price of $401,182.
Fall 2026 Read
The pending-to-closed gap is the lead indicator. Pending volume up 3.9% year-over-year against a 10.1% drop in closings indicates buyers are returning to the contract stage faster than sellers are converting pendings into closed sales. For sellers, the 96% SP/OLP ratio and 26-day DOM mean anchoring list prices to recent comparable closings rather than prior peak levels; pricing above the 96% threshold invites further days-on-market accumulation. For buyers, the 4.9-month supply and 39.4% YoY inventory lift create room for inspection contingencies and negotiated repairs without competitive pressure. Binary projection: if MoI holds above 4.5 and DOM trends above 25 through September, Kirkland pricing remains neutral-to-soft into Q4; if MoI contracts and DOM compresses back toward 20, leverage shifts back toward sellers by November.